File:Two-process model of sleep graph.png
From Polyphasic Sleep Wiki
Size of this preview: 800 × 513 pixels. Other resolution: 1,301 × 834 pixels.
Original file (1,301 × 834 pixels, file size: 370 KB, MIME type: image/png)
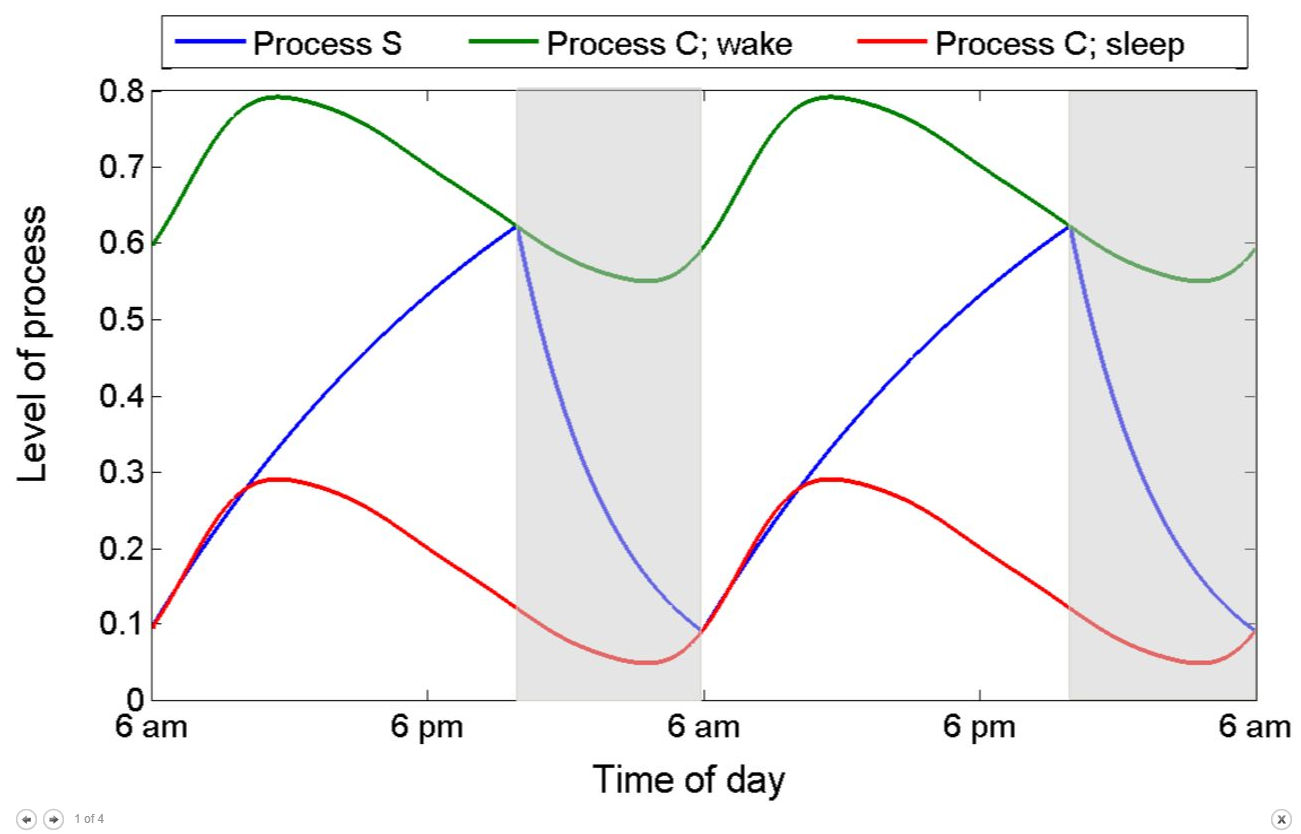
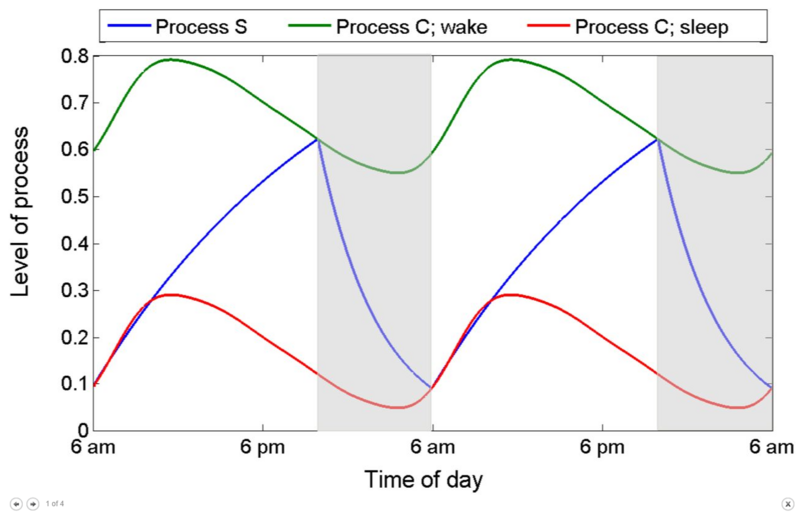
The green and red sinus-functions set the circadian framework in which sleep can occur. The blue function demonstrates the rising sleep pressure during the day, as well as its decrease during sleep. Source: Natalia T., Megan H. H., Paige F., Victoria B. (2017). A Two-Process Model for Circadian and Sleep-dependent Modulation of Pain Sensitivity doi: https://doi.org/10.1101/098319
File history
Click on a date/time to view the file as it appeared at that time.
| Date/Time | Thumbnail | Dimensions | User | Comment | |
|---|---|---|---|---|---|
| current | 23:24, 12 April 2025 | | 1,301 × 834 (370 KB) | Maintenance script (talk | contribs) | == Summary == Importing file |
You cannot overwrite this file.
File usage
The following 2 files are duplicates of this file (more details):
The following page uses this file:
